
Using Choropleth Maps to identify Heatwaves
- Dr Alexa Simm

- Jul 13, 2025
- 1 min read
Statistics are around us every day and understanding statistics is an important life skill.
Take the current heatwave in the UK, as an example. Recognising heatwaves are important for various reasons, including Heat Health Alerts being issued in England and recommended actions being made for organisations and individuals.
But how are heatwaves identified? Well, it's down to statistics.
The threshold for a UK heatwave is when an area records temperatures at or above the 'heatwave temperature threshold' for 3 consecutive days. The threshold temperatures vary across the UK and the Met Office has published a choropleth map showing these heatwave temperature thresholds.
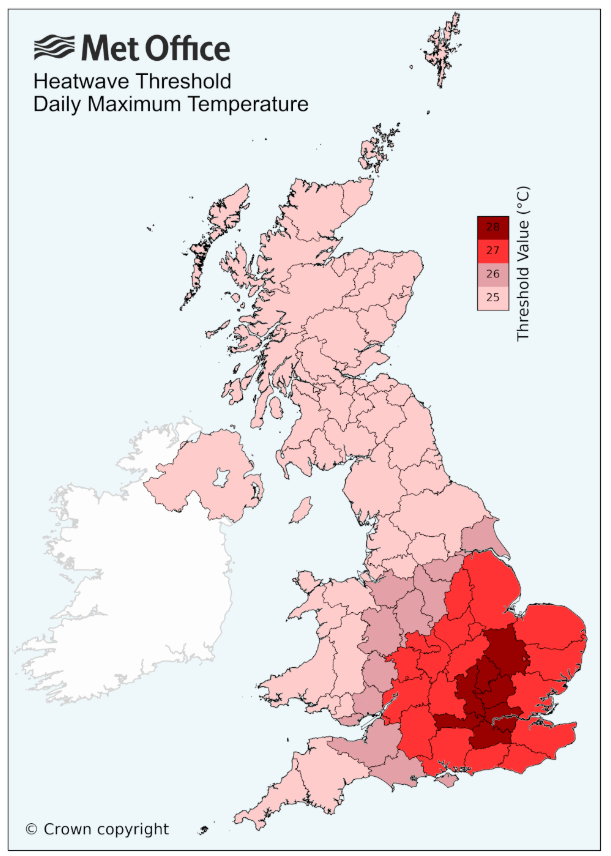
Choropleth maps classify regions of a geographical area by shading, with a key showing what each grade of shading represents. Darker shading represents higher figures or higher temperatures in this example. So, London and South East England have to record higher temperatures to meet the heatwave threshold than Northern Ireland and Scotland.
If you are interested in finding out more, choropleth maps are one topic covered in our GCSE Statistics course.


Comments